Background
Principal Investigators: Dennis Busch, Bill VanRyswyk and Mark Tomer
Organization(s): University of Wisconsin-Platteville Pioneer Farm, Minnesota Department of Agriculture, and Agricultural Research Service USDA, Iowa
Sponsor: CIG Grant, USDA
Award Amount: $625,281
Start Date: 9/15/2011 | End Date: 9/15/2015
This project was part of a three-state partnership to test, demonstrate and promote a simple, inexpensive and reliable new system for edge-of-field water monitoring. The University of Wisconsin-Platteville (UW-Platteville) Pioneer Farm, in collaboration with UW-Platteville Engineering, developed an innovative, low cost monitoring system that obtains good quality edge-of-field monitoring data in production agricultural settings. By eliminating unnecessary features and assembling components in-house, the prototype monitoring system derives the majority of cost savings with minimal sacrifice in accuracy. This project was a coordinated effort between scientists and organizations in Minnesota, Wisconsin and Iowa. The Minnesota portion of the project was conducted in six counties throughout southeastern Minnesota.
Research Objectives
The purpose of this project was to promote edge-of-field surface water quality monitoring and to test a prototype monitoring system designed to reduce cost and technical barriers. To achieve the project goals, the following objectives were defined.
- Install, maintain, and operate eight prototype water monitoring system stations within southeastern Minnesota.
- Determine if discharge and load estimates of the prototype monitoring system differs significantly from estimates generated with a conventional gauging station.
- Evaluate the functionality of the prototype monitoring system in differing landscapes and management practices across southeastern Minnesota.
- Make improvements to the prototype monitoring system based on the results of the quantitative and qualitative evaluations.
- Increase technical capacity of local monitoring programs to conduct edge-of-field monitoring through training opportunities and technical material development.
- Ensure quality data collection by developing and implementing quality control procedures.
- Engage cooperating producers and producer groups in a discussion of results and feasibility of producer operation of stations on a broader scale.
The Value of Edge-of-Field Monitoring
Edge-of-field monitoring provides information about the amount of runoff, soil and nutrients moving off a given field into an adjacent waterway. This site-specific information can be used to inform farm management decisions. In response to both the value and interest in edge-of-field data, the Natural Resources Conservation Service (NRCS) created an interim standard to provide funding for producers, but the high costs associated with conventional gauging of edge-of-field monitoring may deter effective use of this practice.
Conventional gauges provide good overall accuracy (estimated error range of 9.7 to 21%) with a set-up cost of approximately $20,000 per site and operational costs of approximately $25,000 per year. The expected error for the prototype gauge is slightly higher with values ranging from 13 to 23%, but projected costs are significantly less ($4,000 equipment and $10,000 annual operating costs). This cost savings could make edge-of-field monitoring more accessible to individuals and organizations across Minnesota.
Project Locations and Partners
Prototype monitoring systems were installed in Wabasha, Dodge, Rice, Goodhue, Winona and Olmsted counties, which are located in southeastern Minnesota.
In Minnesota, the Minnesota Department of Agriculture worked cooperatively with Dodge County Environmental Services, The Nature Conservancy and Goodhue, Rice, Dodge and Fillmore County Soil and Water Conservation Districts.
Description of Different Landscapes and Management Practices
The new system for edge-of-field water monitoring was tested on a variety of landscapes and cropping systems.
- Dodge County: 14.4 acres, 4.5 % slope, corn-soybean rotation
- Goodhue County 1: 6.3 acres, 5.5% slope, corn- alfalfa rotation, in-line with conventional monitoring system
- Goodhue County 2: 22.3 acres, 2.8% slope, corn-soybean rotation
- Olmsted County: 25.7 acres, 3.1% slope, corn-soybean rotation
- Rice County: 27.3 acres, 3.6 % slope, corn-soybean rotation
- Wabasha County: 11.7 acres, 6.0% slope, corn-alfalfa rotation
- Winona County 1: 2.9 acres, 9.2% slope, pasture with grazing cattle
- Winona County 2: 30.9 acres, 5.6% slope, corn-soybean-alfalfa rotation
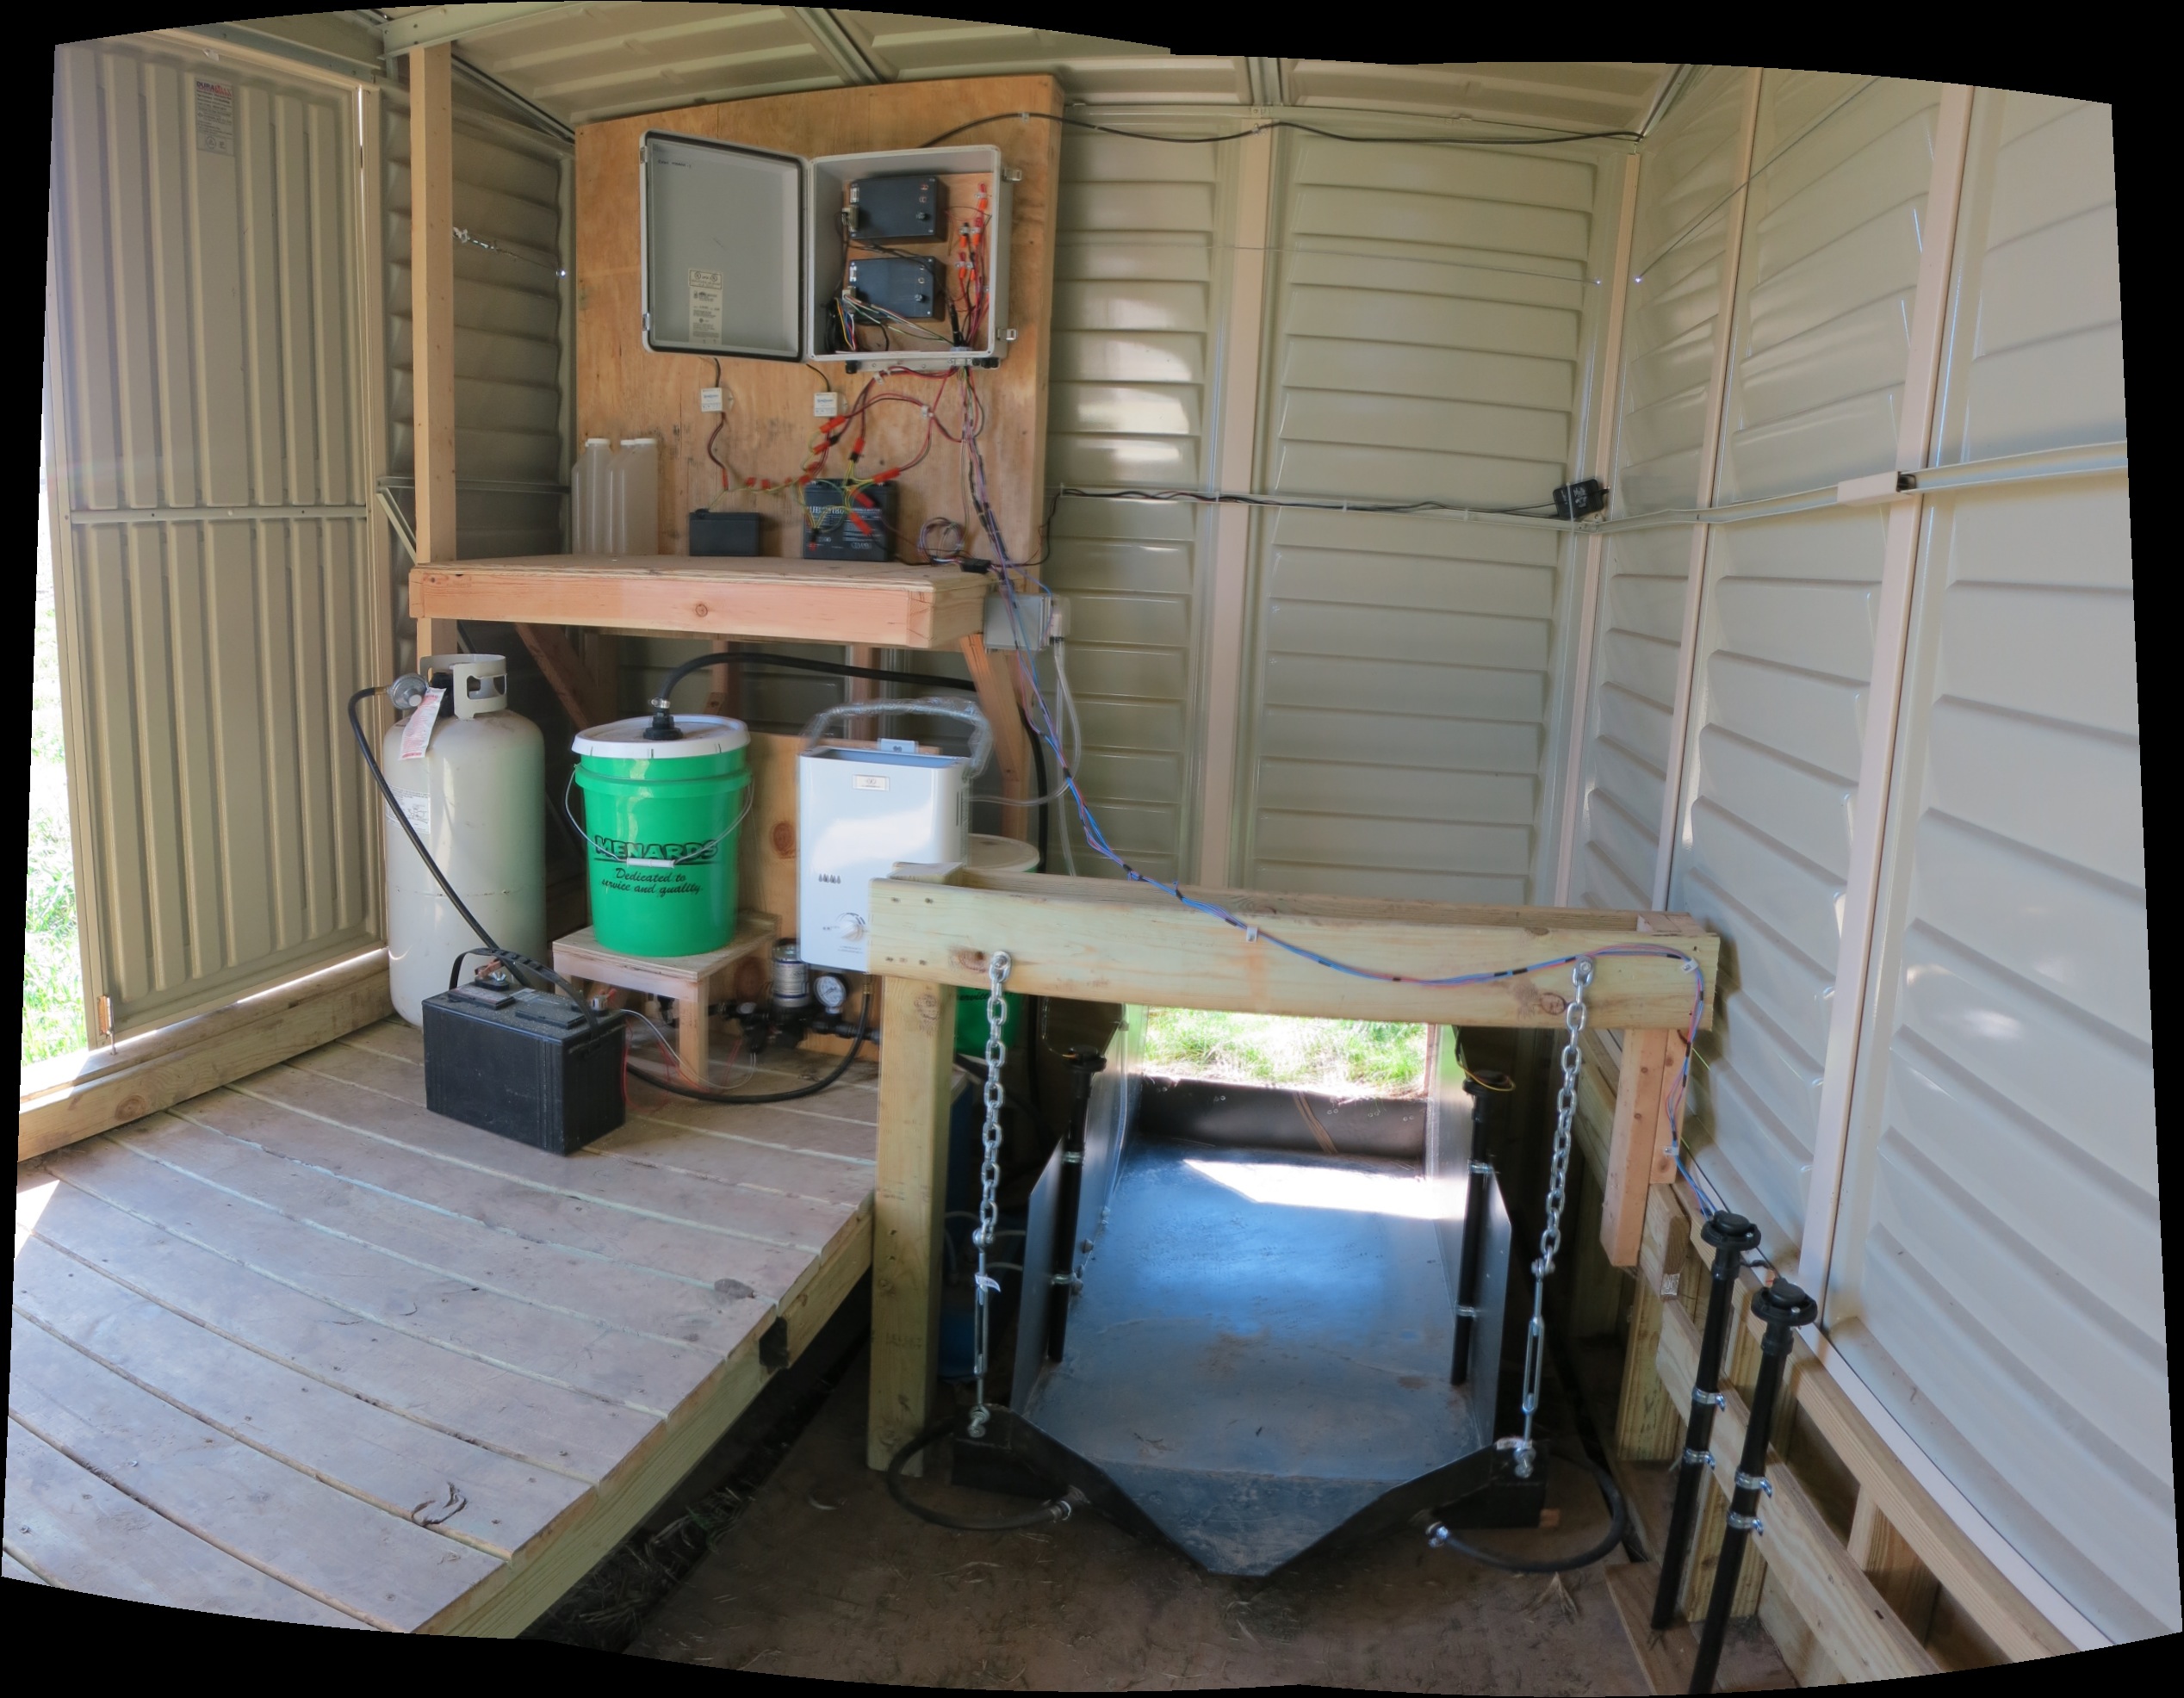
Materials and Methods
All sites were installed with equipment that demonstrated and tests the new methodology. Sampling and gauging protocols were tested at all eight locations using two comparison set-ups. One monitoring location was directly behind or in-line with a conventional gauge. The remaining seven sites had conventional equipment mounted in the same flume as the prototype equipment. By installing the prototype gauging stations in conjunction with a conventional monitoring system, flow, concentration, and load data could be compared to determine if results from the prototype gauge differ significantly from the conventional gauge. Table 1 describes the components utilized in each system.
Table 1. Component Specifications
| Primary Components | Prototype Gauge | Conventional Gauge (In-line site) | Conventional Gauge (In-flume site) |
|---|---|---|---|
| Flume | HXL-Flume, ± 5% accuracy | H-Flume, ± 5% accuracy | HXL-Flume, ± 5% accuracy |
| Flume Stage Sensor | Ultrasonic ± 0.33% Accuracy |
Bubble Line w/ Press. Trans. ± 0.33% Accuracy |
Ultrasonic ± 0.33% Accuracy |
| Tail-Water Stage Sensor | Ultrasonic ± 0.33% Accuracy |
None | None |
| Datalogger | UWP Custom 256 kbytes RAM |
FTS H2 Axiom | Campbell Scientific CR200X |
| Sampler | Peristaltic Sample Repeatability ± 10 ml |
ISCO 6712 Sample Repeatability ±10 ml |
ISCO 3700 Sample Repeatability ±10 ml |
| Back-up Components | |||
| Stage Readings | Wingscapes Birdcam Pro timelapse camera | None | None |
| Sampler | Single Stage Siphon Samplers | None | None |
Deliverables for Minnesota
- In-field evaluations of gauge performance for 8 Minnesota gauges
- A technical manual describing standard operating procedures (SOPs) for gauge installation, operation, and maintenance
- Discharge, yield, and load data for stations in Minnesota
Highlights from the Minnesota Sites
The equipment set-ups at the Minnesota monitoring stations were unique to the project. All eight sites had two sets of equipment (prototype and conventional monitoring equipment) to assess the prototype monitoring equipment. Data from the Minnesota sites were analyzed, compiled into a report and sent to the UW-Platteville to be included in the larger report of results from monitoring stations in Iowa and Wisconsin.
In addition to the quantitative data collected at the monitoring stations, the MDA created a qualitative survey for project partners to provide their comments on how the prototype system worked compared to the conventional system. Highlights from the Minnesota sites below:
Conventional and prototype monitoring systems within the same flume:
- A statistical difference was found during runoff caused by rain over unfrozen ground. This could potentially be attributed to the prototype monitoring system ultrasonic sensors not properly compensating for temperature.
- There was a wide range of variability in percent differences in total flows. The prototype system underestimated total flow by 30% during some events and overestimated by 29% during other events.
- No statistical difference was found for the total load or flow weighted mean concentration analyses between the two systems.
Conventional and prototype monitoring systems "in-line" with one another (one monitoring system set up right behind the other):
- Significant differences in total flow volume, flow weighted mean concentrations
(nitrate-nitrogen), and load assessment (nitrate-nitrogen and total phosphorus). Differences attributed to the higher quality and more precise conventional equipment.
Project partner survey highlights:
- Project partners would not be likely to do this monitoring on their own without the assistance of experts who understand the equipment and know how to analyze the data.
- Prototype system did not seem reliable and the data were inconsistent.
- Heating element was a nice feature with the flume.
Overall Conclusions
The idea for a low-cost system was good but the equipment issues that were associated with the prototype system coupled with the lack of technical support lead to a need for additional improvements to this system. If this system were to be installed on more sites, more research and development should be completed on the flume, datalogger, ultrasonic sensors and pump prior to deploying the system. There was only one chance to collect data on each event with edge-of-field monitoring and if the sensors were inaccurately reading or the pump system failed, the data was missed and there was no second chance.