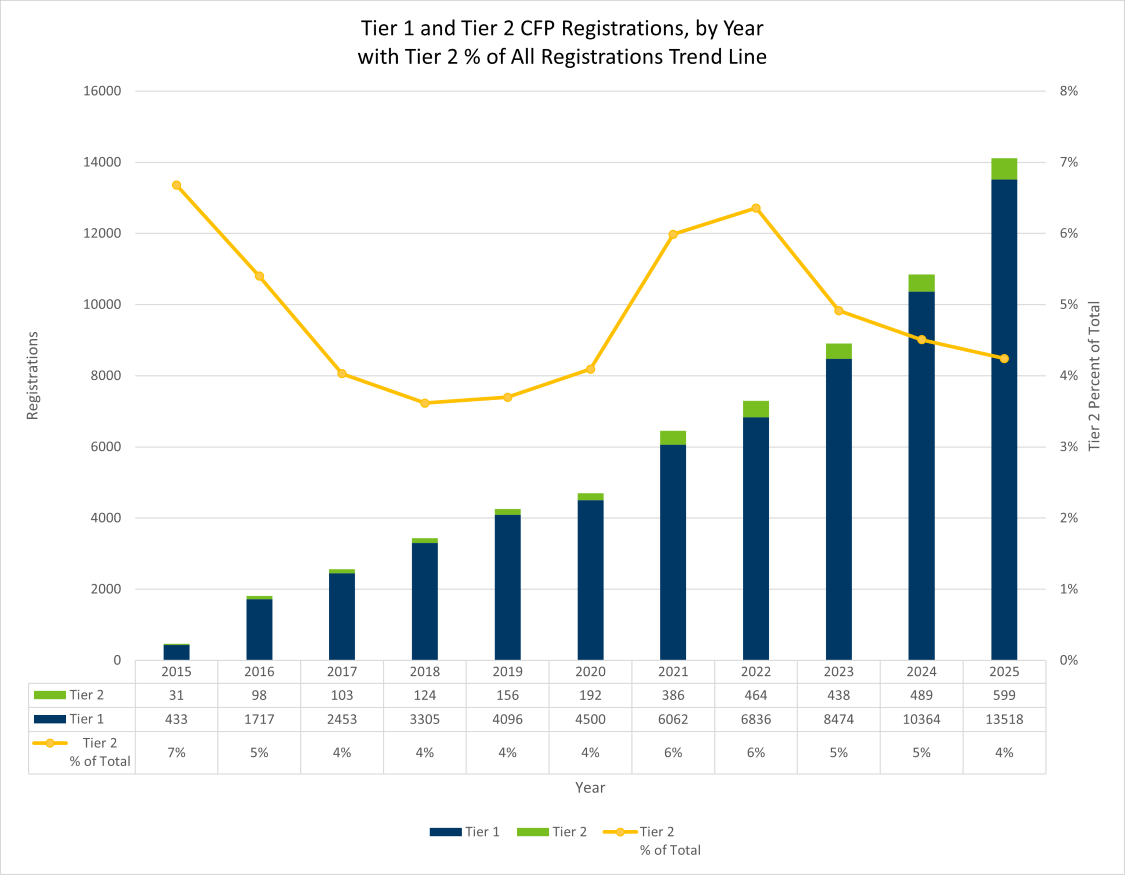
The number of registered Minnesota cottage food producers has continued to grow since the Cottage Food Law went into effect in 2015. The table and graphs below illustrate the changes in the program each year and is updated at the end of the calendar year with the final number of registered producers.
The Minnesota Cottage Food Producers by County map is current and updated in real-time showing where cottage food producers are registered across the state. Note that the map may take time to fully load (will show purple shaded areas when complete).
More information can be found in the two other tabs on the MDA’s Cottage Food Law website under Law Guidance (FAQs) and Registration.
| Year | Total Registrations | Recurring Registrations | New Registrations | % of New Total |
|---|---|---|---|---|
| 2015 | 464 | 0 | 464 | 100% |
| 2016 | 1815 | 291 | 1524 | 84% |
| 2017 | 2556 | 1521 | 1035 | 40% |
| 2018 | 3429 | 2078 | 1351 | 39% |
| 2019 | 4219 | 2747 | 1472 | 35% |
| 2020 | 4860 | 3111 | 1749 | 36% |
| 2021 | 6447 | 3858 | 2589 | 40% |
| 2022 | 7300 | 4382 | 2918 | 40% |
| 2023 | 8912 | 5162 | 3750 | 42% |
| 2024 | 10853 | 6274 | 4579 | 42% |
| 2025 | 14116 | 7676 | 6440 | 46% |