Principal Investigator: David Mulla
Organization(s): University of Minnesota, Department of Soil, Water, and Climate
Award Amount: $95,000
Start Date: 3/1/2007 | End Date: 6/30/2009
Project Manager(s): Adam Birr and Barbara Weisman
Related Journal Article:
Identifying critical agricultural areas with three-meter LiDAR for precision conservation
J.C. Galzki et al., 2011, Journal of Soil and Water Conservation, vol. 66, no. 6, pg 423-430.
Overview
The purpose of this project was to use digital terrain maps and other information to identify priority agricultural lands for implementing best management practices (BMPs). According to Dr. Mulla, “this technology helps us to find the small areas of the landscape that give the biggest bang for the buck in terms of placement of conservation practices.”
This project included two studies, with different techniques (30-meter and 3-meter scale). Both evaluated the effectiveness of terrain analysis to identify areas that may be critical in water quality restoration and protection.
Background Information
Digital terrain analysis is a geographic information system (GIS) tool that allows users to describe/characterize physical landscapes. Digital terrain analysis provides information about hydrological, biological, or geomorphological features. GIS and terrain analysis were used in this study to identify the locations of critical areas.
- Digital terrain analysis allows users to see features of the landscape they could not otherwise see.
- Digital terrain analysis provides information about how water moves across the landscape.
This study defined critical areas as portions of the landscape that accumulate overland flow and are connected to surface waters, either by an overland flow path or by sub-surface drainage. These areas have a higher likelihood of conveying pollutants to surface waters than other portions of the landscape. This project focused on artificially drained upland depressions, ravines and riparian areas.
When present in an agricultural setting, critical areas contribute a disproportionate amount of contaminants such as sediments, nutrients, and pesticides to nearby surface waters. Once identified by terrain analysis, BMPs can be applied to these features to mitigate their impact on water quality. By identifying these features and targeting the areas with the highest priority, water quality benefits are maximized with the most efficient use of resources.
Methods
 In this project, various techniques were used to identify critical source areas. Using 30-meter data, three different critical areas are identified: artificially drained upland depressions, riparian areas, and ravines. 3-m LiDAR (Light Detection and Ranging) data identified finer-scale features such as field gullies or side inlets. LiDAR data provides tremendous topographic details about the landscape.
Terrain attributes, such as slope, flow accumulation, profile curvature, stream power index (SPI), and compound topographic index (CTI), can be calculated from Digital Elevation Models (DEMs) regardless of the spatial resolution of the data. Applying thresholds to these attributes results in GIS data layers that help identify different features on the landscape.
Terrain analysis using 30-meter DEMs can only identify broad landscape features, but the approach is simple and it takes relatively little time to analyze large data sets. This study began with analysis using 30-meter elevation in the Le Sueur River watershed and concluded with analysis using fine-scale (3-meter) data within the Beauford and Seven Mile Creek minor watersheds.
More information about methods and how to process LiDAR data is available in the Final Report (PDF).
Deliverables
- Maps identifying priority agricultural lands relative to turbidity and (as time and data allow) excess nutrients and fecal coliform total maximum daily load (TMDLs) for the Le Sueur and Wild Rice River watersheds. Researchers will describe the method of analysis so it can be replicated by GIS-proficient local government agency staff, and document its limitations and advantages;
- maps depicting critical source areas of sediment transport for the pilot watersheds based on high resolution LiDAR terrain data; and
- a methodology for identifying the critical source areas that is applicable to broad areas of both the Minnesota River and Lower Mississippi River Basins as more LiDAR data is acquired in those regions.
Results from the entire Le Sueur River watershed
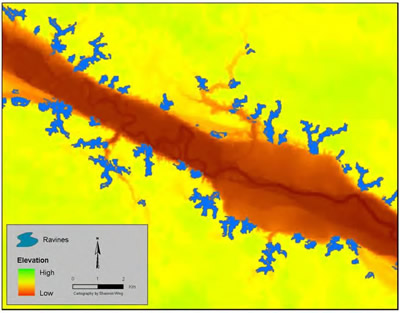
Terrain attributes derived from 30-m DEMs were used to identify critical areas across the entire Le Sueur River watershed.
- Terrain analysis was effective at identifying ravines.
- Sixty-five sites were visited in the field, and 90% of those were confirmed as active ravines.
- Terrain analysis was effective at identifying upland depressions.
- Upland depressions cover only 7% of the watershed, a majority of these features (85%) are in agricultural production.
- Riparian areas make up more than one fourth of the watershed, and over half of these features (59%) are in agricultural lands.
- One third of riparian areas had slopes greater than 3 %, and are thus considered priority riparian areas.
Large Improvements in the Quality of Digital Terrain Data
The second part of this study investigated the effectiveness of using LiDAR (Light Detection and Ranging) data to identify areas that accumulate surface flows and that are hydrologically connected to surface waters.
With the advancement of LiDAR technologies, the topography of landscapes can be described with highly accurate elevation data. These data can be stored, processed, and analyzed in a geographic information system (GIS). Using GIS software, terrain attributes can readily be calculated from this data; these attributes can be used to find sensitive areas on the landscape very rapidly, which may guide field surveys and help find erosional features on the ground. Once identified, these features can be targeted with management practices, and their effects on surface water pollution can be minimized.
Field Validation
Terrain attributes at the 3-m scale were calculated just as attributes calculated on a 30-m scale for this part of the study.
Surveys were conducted in both the Seven Mile Creek watershed and Beauford minor watershed along the riparian corridor to identify sources of erosion and overland flow paths connected to surface water. All gullies, side inlets, and subsurface drainage outlets were recorded with a GPS receiver in the field. The Brown Nicollet Cottonwood Water Quality Board collected a large data set for the Seven Mile Creek Watershed. Data for the Beauford watershed was collected by staff with the Minnesota Department of Agriculture. This area contains more side inlets and fewer gullies than in the Seven Mile Creek Watershed. Surveys identified 83 gullies in the Seven Mile Creek watershed and 22 side inlets were in the Beauford watershed.
For more details about research methods and field validation, please refer to the Final Report (PDF).
Results for Seven Mile Creek and Beauford
- For both watersheds, the average Stream Power Index (SPI) values at field-surveyed sites were found to be the most useful for identifying these features. SPI essentially isolates areas with both a high catchment and a high slope.
- Although insufficient data are available to create a quantitative relationship, study findings suggest that values for terrain attribute such as SPI can be used to infer the ordinal size of erosional features and target management practices to the largest features. Further study is needed to attempt to quantify the relationship between SPI values and the size of erosion features.
- An exhaustive GIS-based field survey was conducted in the Seven Mile Creek Watershed. 122 points were created at SPI signature interfaces denoting areas that should be field surveyed for validation.
- 43 of these 122 points (35%) were not closely related to an erosional feature in the exhaustive field survey. These can be interpreted as type 1 commission errors, or false positives.
- 14 features (11%) that were identified in the GIS survey were identified in field survey as either a tile outlet location or stream bank erosion.
- Nearly 80 percent of all gullies in the watershed were identified by this method.
- When focusing on the largest contributors in the watershed or only high Sediment Delivery Potential (SDP) score gullies, 31 of 32 were identified.
- This study reinforced that LiDAR terrain analysis can effectively identify gully erosion features and can serve as a valuable guide for natural resource planners.
Conclusions
- Terrain attributes such as Specific Catchment Area and the Stream Power Index can be readily used to identify critical source areas of runoff in upland areas.
- Targeting can be matched to financial constraints with a high likelihood of capturing the largest features.
- BMPs targeted to these features can maximize their benefits on water quality and also maximize the efficiency of funding used for conservation.
- These methods are easy to employ and can serve as a valuable use of newly acquired LiDAR data
- Further work is needed to determine the applicability to other regions of the state.
- Water quality monitoring data is needed to further explore relationships to the terrain attribute values.