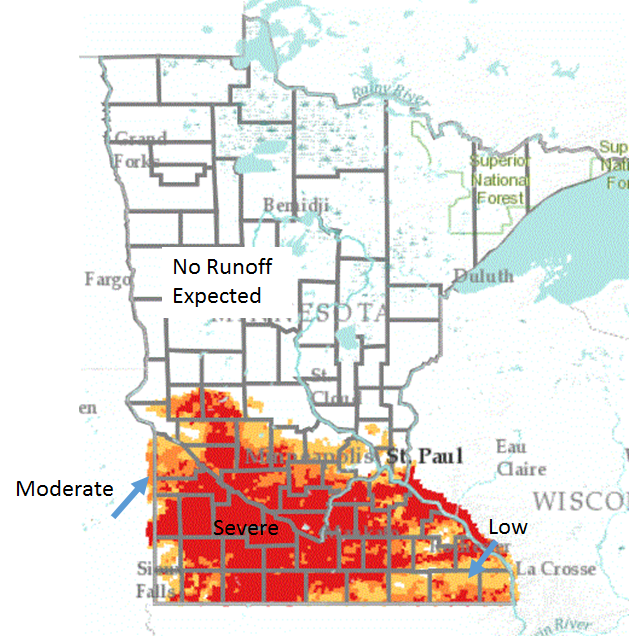
To help illustrate how to use the RRAF, we've included an image of a daily risk map for Minnesota on June 19, 2018.
The colors on the map indicate levels of runoff risk. The maps are based on a NWS flood forecast model. Cropped fields are smaller than the grids and can vary considerably within a grid. Local characteristics can significantly affect the model's applicability to a given field. Always apply your own knowledge of the landscape when assessing the risk of runoff for your fields.
No event (white or clear): There is no runoff predicted for that time period.
Low (light yellow): The risk of a runoff event occurring is low.
Moderate (orange): The risk of a runoff event occurring is moderate. Use this information along with other factors to determine if there should be spreading.
Severe (red): The risk of runoff occurring in this grid is high. Use this information along with other factors to determine if there should be spreading.
If you need to spread manure on a high risk day, learn how best to approach this situation using resources from the University of Minnesota Extension.
Pop-up boxes provide details for each grid
1. To access further information for your location, zoom in on the map until the Popup Information, in the "Operational layers" list on the left hand side, turns active (not greyed out).
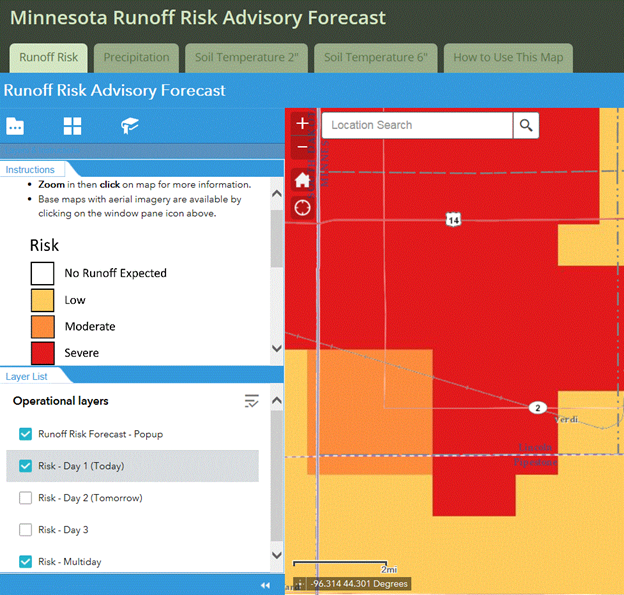
2. Select a grid (1.24 mile by 1.24 mile cell) for more information. A condensed table will pop up, click it to expand. See the example table below, it contains information from Sheridan Township in Redwood County on June 19, 2018.
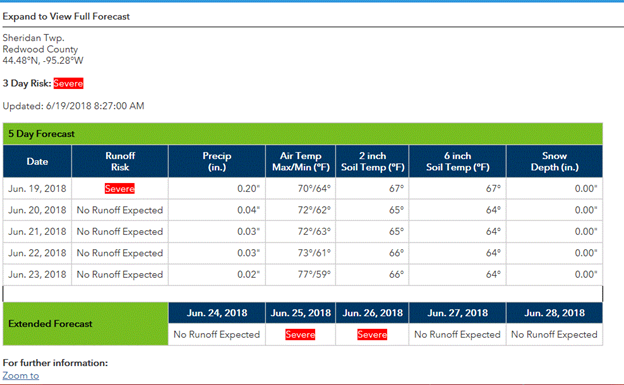
Information on the table includes:
- Township, county and latitude/longitude
- Five-day forecast: The NWS supplies the forecast for the next five days for each grid. Data includes precipitation, air temperature maximum and minimum, six-inch soil temp, and snow depth. Although the data are already factored into the runoff calculations, they may be useful guides as you assess risk.
- Single-day runoff risk level: Rather than looking at the maximum predicted runoff over the forecast period, the runoff predicted for each day is compared to the grid threshold to determine the day's runoff risk level for each day. Keep in mind that there is more uncertainty to the rainfall and subsequent runoff predictions as you look further ahead.
- Three-day runoff risk level: The data for the third day coincides with the coloration on the map. In winter, when the forecast is looking out ten days, the date of the earliest forecast runoff event is displayed.
- Extended Risk Forecast: (sixth through tenth day) Keep in mind that there is more uncertainty to the rainfall and subsequent runoff predictions as you look further ahead.