A combination of monitoring methods are used to measure nitrate-nitrogen in soil water and groundwater.
View the February 2023, Byron #1 Field Study Groundwater Monitoring Report.
The report is located in the Minnesota Water Research Digital Library.
Soil Water Monitoring
Suction Tube Lysimeters
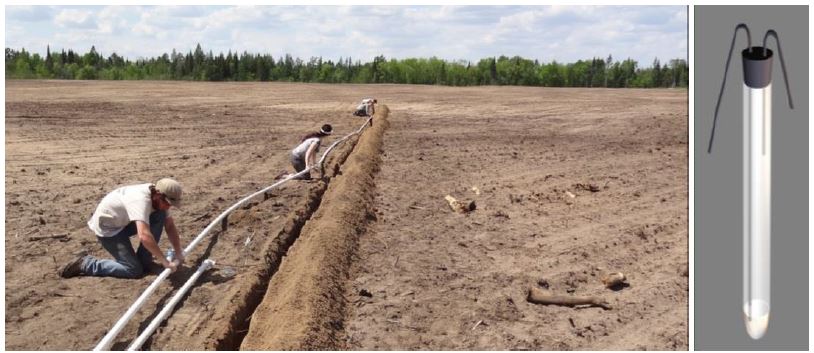
During the growing seasons, soil water is collected weekly from 15 suction tube lysimeters, and samples are analyzed for nitrate-nitrogen. The lysimeters are pulling water from the tiny spaces within the soil, known as soil pores. The lysimeters were installed at a 4-foot depth to collect soil water that has moved past the crop rooting depth and could potentially move down to groundwater. The tips of the lysimeters are made of a porous ceramic material that water flows through when suction is placed on the tubes.
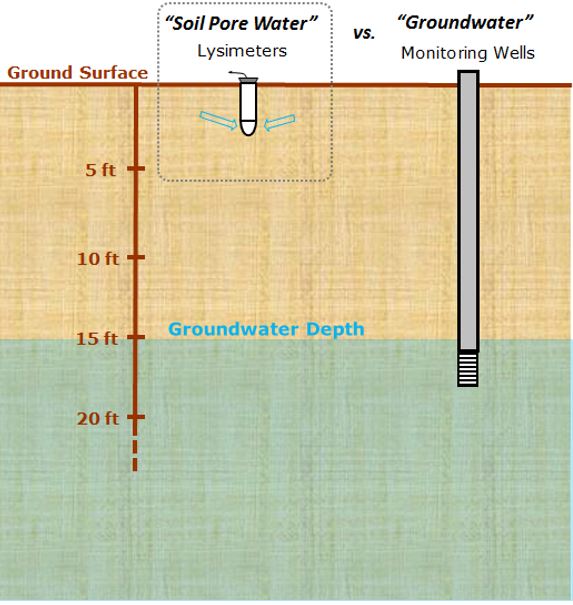
The water measured using lysimeters is soil pore water, which is shallower than groundwater. The image below shows the vertical difference between soil pore water and groundwater.
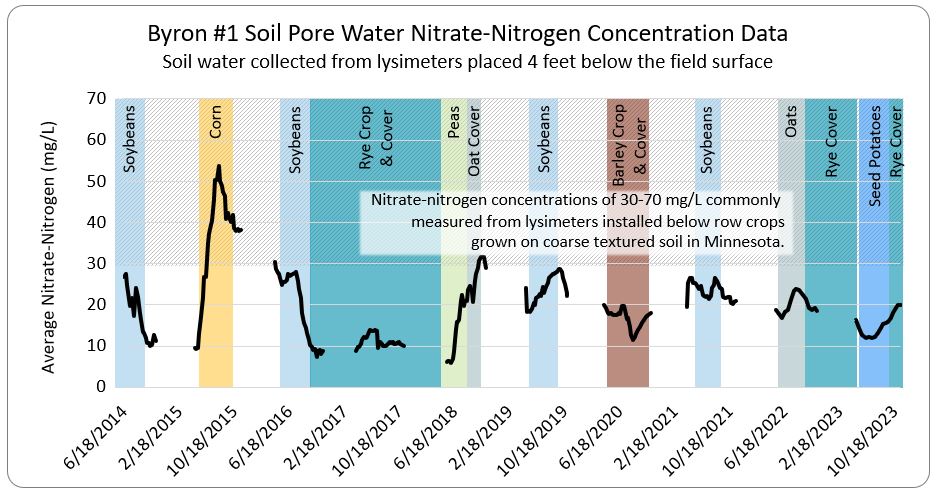
The graph shows the average soil pore water nitrate-nitrogen concentrations observed at four feet beneath the Byron #1 site from 2014 through 2021. Nitrate-nitrogen measured below similar field demonstration sites throughout central Minnesota have ranged from 30-70 mg/L throughout rotations that include corn, soybeans, potatoes, and edible beans. This preliminary data shows that nitrate-nitrogen concentrations from Byron #1 are measuring in a range comparable to or less than other locations.
Samples are analyzed for nitrate-nitrogen concentration using an ultraviolet spectrophotometer. Results are averaged to gain more representative information. For quality assurance, 10% of the samples are sent to a certified lab for analysis.
Drain Gauges
Installed below the crop rooting zone, at a 4-foot depth, drain gauges measure the volume of water that moves through the soil profile. This information combined with nitrate-nitrogen concentration data from lysimeters can provide an estimate of groundwater loading in terms of pounds of nitrate-nitrogen per acre.
Groundwater Monitoring Wells
As part of this field study, seven shallow monitoring wells were installed around the field perimeter in early November 2014. Over time, these wells will help provide a better understanding of the movement of shallow groundwater below this field and provide a way to measure the nitrate-nitrogen concentration of this water throughout the year.