Principal Investigator: David Mulla
Organization: University of Minnesota, Department of Soil, Water, and Climate
Award Amount: $448,953
Start Date: 5/1/2013 | End Date: 3/31/2018
Project Manager: Jeppe Kjaersgaard (Jeppe.Kjaersgaard@state.mn.us)
FINAL REPORT is available in the Minnesota Water Research Digital Library
Introduction
The goal of good nutrient management is to maximize the amount of fertilizer used by the crop and minimize the amount lost in the environment. The most common pathways for nitrogen loss, in agricultural settings, are volatilization (nitrogen loss to the atmosphere) and leaching (loss of water soluble nitrate through the soil profile). This project evaluates technology that can help farmers more precisely apply nitrogen fertilizer according to the crop’s needs, optimizing the amount used by the plant and minimizing the amount that is vulnerable to loss.
Research Objectives
-
Evaluate the ability of various types of remote sensing approaches to detect nitrogen (N) stress in corn at different times of the growing season.
- Evaluate the effect of variable rate application of N fertilizer on corn yield
- Assess benefits of variable rate N fertilizer application on surface water quality
Background Information- Remote Sensing
 New tools and technology are helping farmers be more precise with nitrogen fertilizer management. This research project explores technology referred to as remote sensing.
When farmers observe their fields and crops without physically touching them, it is a form of remote sensing. Observing the colors of leaves or the overall appearances of plants can determine the plant’s health. Remotely sensed images taken from satellites and aircraft provide a means to assess growing crops from a point of view high above the field.
Remote sensors see the same visible wavelengths of light that are seen by the human eye, and in most cases remote sensors also detect energy from wavelengths that are undetectable to the human eye. Remote sensors can be used during the growing season to assess the health of growing crops, without disturbing or damaging those crops. The ability to store, analyze, and display the sensed data on field maps, in real time, is what makes remote sensing a potentially important tool for agricultural producers. Agricultural remote sensing is not new; it dates back to the 1950s, but recent technological advances have made the benefits of remote sensing accessible to most agricultural producers.
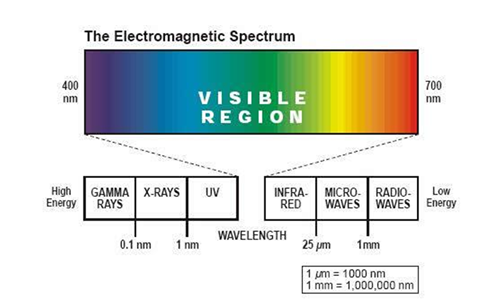
The visible region of the electromagnetic spectrum is from about 400 nanometers (nm) to about 700 nm. The green color associated with plant vigor has a wavelength that centers near 500 nm. Wavelengths longer than those in the visible region and up to about 25 micrometers (µm) are in the infrared region. The infrared region nearest to that of the visible region is the near infrared (NIR) region. Both the visible and infrared regions are used in agricultural remote sensing (see image above).
Many Benefits of Remote Sensing
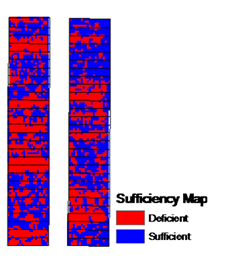
Remotely sensed images can be used to identify nutrient deficiencies, diseases, water deficiency or surplus, weed infestations, insect damage, hail damage, wind damage, herbicide damage, and plant populations. Information from remote sensing can be used to map variable rate applications of fertilizers and pesticides. Remote sensing allows farmers to identify problems within a field, often before they can be visually identified. For instance, it is used to identify stressed areas in fields by first establishing the spectral signatures of healthy plants. The spectral signatures of stressed plants appear altered from those of healthy plants.
The comparison of the reflectance values at different wavelengths, called a vegetative index, is commonly used to determine plant vigor. The most common vegetative index is the normalized difference vegetative index (NDVI). NDVI compares the reflectance values of the red and NIR regions of the electromagnetic spectrum. The NDVI value of each area on an image helps identify areas of varying levels of plant vigor (or health) within fields.
Study Area and Methods
OBJECTIVE 1: COMPARISONS BETWEEN VARIOUS REAL-TIME SENSORS AND AERIAL REMOTE SENSING TECHNIQUES
At two southern Minnesota sites during both of the first two years, a randomized complete block design with four replications of 15 nitrogen rate treatments will be established in a corn following soybean rotation.
The nitrogen rates range from 0 to 202 kg/ha (0 to 180 lbs /ac). This wide range of nitrogen treatments will allow for testing of remote sensing systems under a wide range of N stress conditions.
Prior to the experiment, soil samples and aerial remote sensing images were collected and used for calibration.
Nitrogen Treatments
| ID | Preplant | V8 | V12 | Total | Description | Total |
| kg/ha | lbs./acre | |||||
| 1 | 0 | 0 | 0 | 0 | Control | 0 |
| 2 | 34 | 0 | 0 | 34 | Very low preplant | 30 |
| 3 | 67 | 0 | 0 | 67 | Low preplant | 60 |
| 4 | 101 | 0 | 0 | 101 | Medium preplant | 90 |
| 5 | 134 | 0 | 0 | 134 | Adequate preplant | 120 |
| 6 | 168 | 0 | 0 | 168 | High preplant | 150 |
| 7 | 202 | 0 | 0 | 202 | Very high preplant | 180 |
| 8 | 34 | 67 | 0 | 101 | Early medium split | 90 |
| 9 | 34 | 101 | 0 | 134 | Early adequate split | 120 |
| 10 | 67 | 34 | 0 | 101 | Early low split | 90 |
| 11 | 67 | 67 | 0 | 134 | Early high split | 120 |
| 12 | 34 | 0 | 67 | 101 | Late medium split | 90 |
| 13 | 34 | 0 | 101 | 134 | Late adequate split | 120 |
| 14 | 67 | 0 | 34 | 101 | Late low split | 90 |
| 15 | 67 | 0 | 67 | 134 | Late high split | 120 |
Ground Based Crop Reflectance Readings
Three ground-based and one aerial-based remote sensing tool will be evaluated:
A Minolta SPAD-502 Chlorophyll Meter, CropCircle reflectance sensor and Greenseeker sensor will be used in each experimental plot to measure relative reflectance and nitrogen stress from early June to late July.
Aerial Based Canopy Reflectance Measurements
Multispectral imagery over the entire field collected on two dates with a MikroKopter Octo unmanned aerial vehicle (UAV) or a Goodrich Optio UAV mounted with a GPS and Tetracam mini multiple camera array (MCA) multispectral imaging camera.
The Optio unmanned aerial vehicle (manufactured by Goodrich) is a light (16 lbs), fixed wing aircraft that can be controlled by a ground operator. It has a flight range of 15.5 miles (25 km) and 2 hours. The Tetracam mini-MCA can be mounted on the Optio, and captures imagery with 6 bands covering a spectral range from 470-830 nm (blue to NIR), each band covers 10 nm. Band 1 is at 470 nm (blue), band 2 is at 550 nm (green), band 3 is at 660 nm (red), band 4 is at 690 nm (early red-edge), band 5 is at 720 nm (late red-edge), and band 6 is at 830 nm (NIR). Reflectance in the red-edge portion of the spectrum is very sensitive to N deficiency in corn.
OBJECTIVES 2 AND 3: FIELD SCALE EVALUATION OF THE IMPACTS OF VARIABLE RATE N FERTILIZER ON CROP YIELD AND WATER QUALITY
Variable rate fertilizer application allows farmers to apply different rates of fertilizer at multiple locations across fields.
The first approach for evaluating the impacts of real time variable rate N fertilizer management will be based on contacting farmers who are involved in these two efforts to identify how much N fertilizer they are applying, on average, to the fields where these remote sensing based technologies are being used. Researchers will compare these rates with other fields that they manage without remote sensing to determine whether real time variable rate N fertilizer management has any impact on overall applied rates of N fertilizer. Similarly, researchers will inquire about the average crop yields in fields with and without variable N rate fertilizer management to identify any potential impacts on the profitability of precision N management.
Once the overall rates of applied N fertilizer are known, these rates can be used with a variety of simulation models to predict nitrate-N losses through drainage. One simulation model is the recently developed Nitrogen Reduction Planning Tool (Lazarus and Mulla, 2012) which is capable of estimating nitrate-N losses to drainage at the watershed scale, assuming various adoption rates for reduced N rates on corn. Another is the more mechanistic DRAINMOD-based simulation model (Nangia et al., 2008), which operates at a field scale.
The second approach will be to recruit two to three of the producers in the pool who are using some form of real time variable rate N fertilizer management for installation of on-farm studies of its effectiveness. Researchers will deploy the best performing remote sensing technique developed in Objective 1 on each farm field to control real time variable rate N fertilizer applications.
Each study field will be split into at least two parts, each having separate subsurface tile drainage systems. One part will receive the farmer’s normal uniform rate N fertilizer management strategy. The other will receive the real time variable N rate fertilizer management strategy based on optical sensors or remote sensing with unmanned aerial vehicles. Average crop yield will be determined in each portion of the field to enable a comparison of the economic impacts of variable rate N management.
Water quality at the outlet of each subsurface tile drainage system will be monitored continuously over the growing season to assess differences in nitrate-N losses through drainage of the uniform versus variable rate N management practices. Water quality monitoring protocols will be consistent with those described in the Discovery Farms Standard Operating Procedures Manual.
Deliverables
- Accuracy of Greenseeker, CropCircle, and an ADC micro camera at detecting N stress in corn will be evaluated.
- Spectral indices that are sensitive to N stress in corn will be identified.
- Thresholds based on nitrogen sufficiency index will be developed that identify the onset of N stress in corn.
- The impact of real time variable N fertilizer management on crop yield will be measured relative to crop yield under conventional N fertilizer management. These data will be used to estimate impacts of variable rate technology on farm profitability.
- The impact of real time variable N fertilizer management on nitrate-N losses in subsurface tile drainage will be measured and modeled relative to losses under conventional N fertilizer management.